In the face of rising global trade protectionism, China’s steel industry has demonstrated remarkable resilience, with exports maintaining strong growth through strategic market diversification and product optimization.
China’s steel exports defied global trade headwinds in 2025, with January-September exports reaching 87.96 million tons, a 9.0% year-on-year increase . This growth occurred despite an unprecedented wave of anti-dumping measures across major markets, demonstrating the industry’s adaptability in navigating complex international trade dynamics.
1. Export Performance and Market Dynamics
The steady growth in China’s steel exports throughout 2025 highlights the effectiveness of its strategic pivot toward emerging markets and product optimization. The export volume and value trends reveal a complex picture of adaptation to global market conditions.
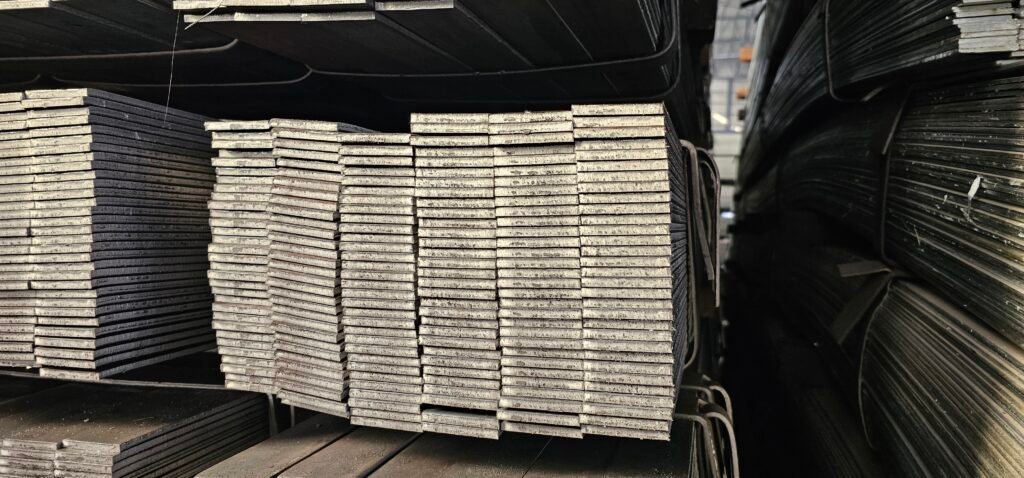
Table: China’s Steel Export Trends (2020-2025)
| Year | Export Volume (million tons) | Year-on-Year Change | Key Market Focus |
|---|---|---|---|
| 2020 | 53.7 | – | Pandemic-affected global demand |
| 2021 | 66.9 | +24.6% | Initial post-pandemic recovery |
| 2022 | 67.3 | +0.9% | Market stabilization |
| 2023 | 90.3 | +34.1% | Southeast Asia, Middle East |
| 2024 | 110.7 | +22.7% | Diversification across emerging markets |
| 2025 (Jan-Sept) | 88.0 | +9.0% | Middle East, Africa, Southeast Asia |
The export dynamics in 2025 present a “volume-up, price-down” pattern . While export volumes increased significantly, the average export price fell to $696.7 per ton, a decline of 9.5% year-on-year . This price advantage has been instrumental in maintaining China’s competitiveness despite growing trade barriers.
Chart suggestion: Line chart showing export volumes (left axis) and average prices (right axis) from 2020-2025, highlighting the inverse relationship between volume growth and price trends in recent years.
2. Regional Market Shifts: From Traditional to Emerging Markets
China’s steel export strategy has undergone a significant geographical reorientation, moving from traditional markets to emerging economies in response to trade barriers and evolving global demand patterns.
2.1 Southeast Asia: Sustained Dominance with Changing Dynamics
Southeast Asia remains China’s largest regional market, though its composition has evolved. While Vietnam’s imports decreased by 25% in H1 2025 due to anti-dumping duties, other ASEAN members like Thailand, the Philippines, and Indonesia saw increased imports . The region accounted for 30% of China’s total steel exports in 2024 , with infrastructure development continuing to drive demand.
2.2 Middle East and Africa: New Growth Frontiers
The Middle East and Africa have emerged as the fastest-growing destinations for Chinese steel. In H1 2025, exports to the Middle East surged by 18% year-on-year, with the UAE and Saudi Arabia importing 2.85 million tons and 2.56 million tons respectively . Africa witnessed even more dramatic growth, with exports to Nigeria skyrocketing by 108% and Tanzania by 60% .
Chart suggestion: World map with heat layers or proportional symbols showing the changing patterns of China’s steel exports by region from 2020 to 2025, highlighting the shift from traditional to emerging markets.
2.3 Other Emerging Markets
Latin America has also become a significant destination, with exports to the region growing by 24% in H1 2025 . Countries like Peru and Chile recorded import growth of 37% and 23% respectively, while Brazil remained the largest importer in the region despite modest growth .
3. Product Mix Optimization: Toward High-Value Exports
China’s steel export structure has evolved significantly, with a notable shift toward higher-value products despite the overall “volume-up, price-down” trend.
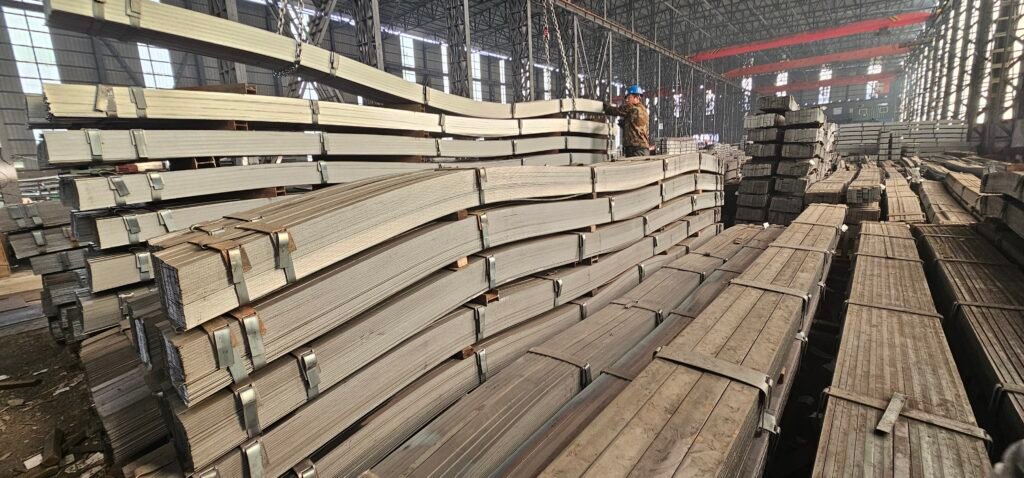
Table: China’s Steel Export Product Structure (2025)
| Product Category | Share of Total Exports | Year-on-Year Change | Primary Applications |
|---|---|---|---|
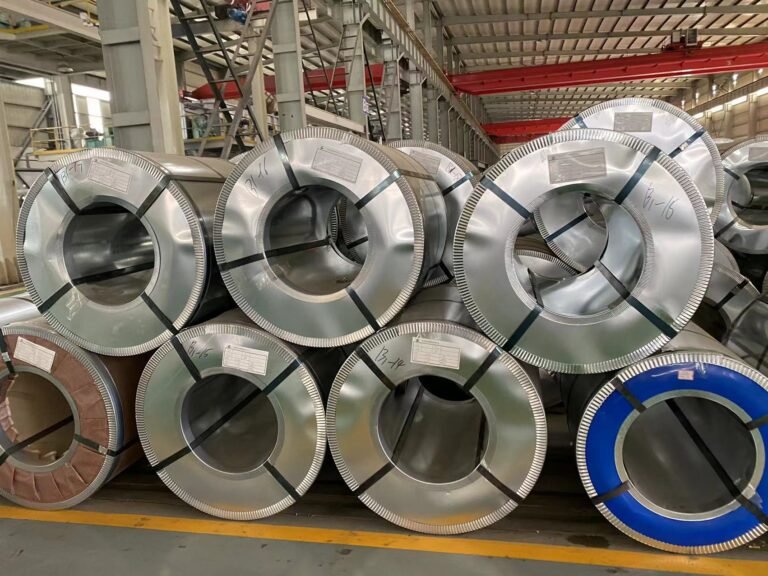
| Plated Steel | 17.5% | +0.4 percentage points | Automotive, construction |
| Hot-Rolled Coils | 16.2% | -2.1 percentage points | Manufacturing, infrastructure |
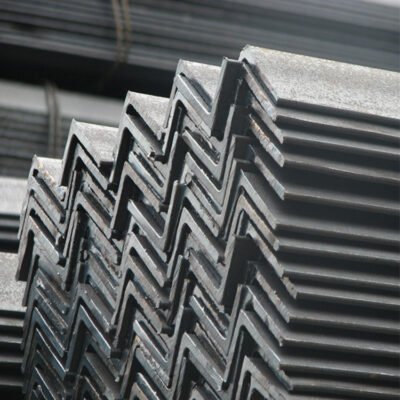
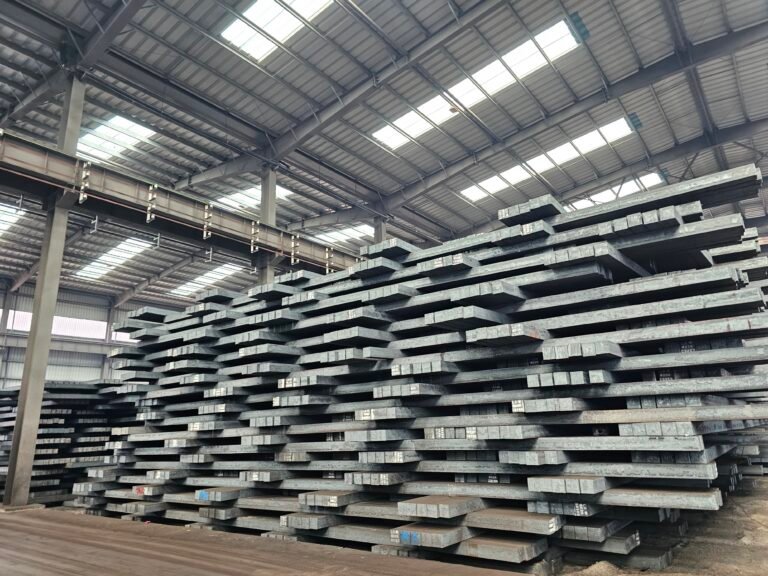
| Medium and Heavy Steel Strips | 12.8% | +3.5 percentage points | Shipbuilding, bridges |
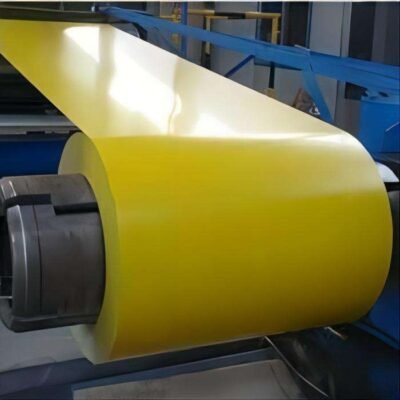
| Color Coated Plates | 9.3% | -0.6 percentage points | Construction, appliances |
| Other Products | 44.2% | Mixed trends | Various industries |
Electrical steel has emerged as a standout product in China’s export portfolio. In 2024, production accounted for 67% of the global total, with exports increasing by 17.52% to 1.45 million tons . This growth is largely driven by global energy transition demands, particularly from the new energy vehicle industry.
The first three quarters of 2025 saw significant growth in exports of plated sheet and strip, which maintained its position as the largest export category, comprising 17.5% of total exports . Meanwhile, hot-rolled products continued to face challenges, with export volumes declining due to anti-dumping measures in multiple markets .
Chart suggestion: Stacked bar chart showing the year-on-year changes in export volume by product category, highlighting the growth in high-value products like electrical steel and the decline in traditional products like hot-rolled coils.
4. Strategic Responses to Trade Barriers
Faced with increasing protectionism, Chinese steel exporters have implemented multifaceted strategies to maintain their global market presence.
4.1 Market Diversification and “Capacity Going Global”
The diversification of export markets has been the cornerstone of China’s response to trade barriers. While traditional markets implemented restrictions, Chinese exporters successfully pivoted to emerging economies in the Middle East, Africa, and Latin America .
The “capacity going global” strategy has gained momentum, with Chinese steelmakers establishing production facilities overseas. Projects like Baowu Group’s 2.5 million ton direct reduced iron plant in Saudi Arabia and Delong Group’s 20 million ton steel project in Indonesia represent strategic moves to circumvent trade barriers by localizing production .
4.2 Product Upgrading and Value Addition
Chinese steelmakers have accelerated product upgrading to enhance competitiveness. The proportion of high-end steel products reached approximately 35% of total exports , with companies increasing investment in R&D to develop specialized products for niche markets.
The growth in indirect exports has created an alternative channel for steel trade. In 2024, machinery, automotive, and electrical product exports grew significantly, driving indirect steel exports to approximately 127 million tons . This indirect channel helps mitigate the impact of direct steel trade barriers.
5. Price Advantage and Competitive Positioning
China’s sustained price advantage remains a critical factor in its export competitiveness. In June 2025, **China’s hot-rolled coil export offers hit a five-year low of 445/tonFOBRizhao∗∗,significantlybelowoffersfromcompetitorslikeSouthKorea(499/ton) and Russia ($474/ton).
This price differential is particularly evident in specific product categories. For example, China’s galvanized sheet export price averaged 652/ton,comparedto745/ton for Indian products and 810/tonforTurkishproducts.This∗∗93-158/ton price advantage** has been crucial in maintaining market share despite tariffs.
Chart suggestion: Comparative bar chart showing export prices ($/ton) of key steel products from China, India, Turkey, and South Korea, highlighting China’s price advantage.
6. Future Outlook and Challenges
The outlook for China’s steel exports involves navigating both opportunities and challenges in an increasingly complex global trade environment.
6.1 Moderating Growth Trajectory
While exports remain robust, growth rates are expected to moderate in the latter half of 2025. Mysteel Global projects a contraction of 5 million tons year-on-year in H2 2025, with full-year exports totaling 110.6 million tons . This moderation reflects the combined impact of front-loaded shipments in early 2025 and growing trade tensions.
6.2 Persistent Trade Barriers
Trade friction continues to pose significant challenges. By 2025, over 70 anti-dumping cases had been filed against Chinese steel products , with emerging economies increasingly joining traditional markets in implementing restrictions. Vietnam, Brazil, and Turkey have all initiated new anti-dumping investigations or measures targeting Chinese steel .
6.3 Green Transformation Imperative
The green transition is becoming a critical factor in maintaining long-term competitiveness. The EU’s Carbon Border Adjustment Mechanism (CBAM), scheduled for full implementation in 2026, will require carbon emission accounting for steel exports . Chinese producers are investing in hydrogen-based steelmaking and other low-carbon technologies to align with global decarbonization trends .
Conclusion: Strategic Adaptation in a Changing Global Landscape
China’s steel export sector has demonstrated remarkable resilience in navigating the complex trade environment of 2025. Through strategic market diversification, product optimization, and sustained price competitiveness, the industry has maintained strong export performance despite growing protectionism.
The strategic shift toward emerging markets, coupled with continued investment in high-value products and green technologies, positions China’s steel industry to navigate the challenges and opportunities ahead. As global trade dynamics continue to evolve, flexibility and innovation will remain essential for sustaining China’s leadership in the global steel market.